


ECOC 2025 Tech Focus: Eoptolink on the Challenges of Data Center Optical Interconnect
Updated: 21 hours ago
Introduction
As AI and high-performance computing (HPC) demand keeps rising, data center networks are moving into the 800G, 1.6T and even 3.2T generations. Along the way, optical module power consumption, form factors, and system design trade-offs have become key issues for the industry.
At ECOC 2025, Eoptolink shared its view of the challenges in data center optical interconnect, focusing on the 1.6T evolution path, power breakdown, and a comparison of linear and co-packaged approaches, as well as the hurdles that must be cleared to reach 3.2T.
Key Points
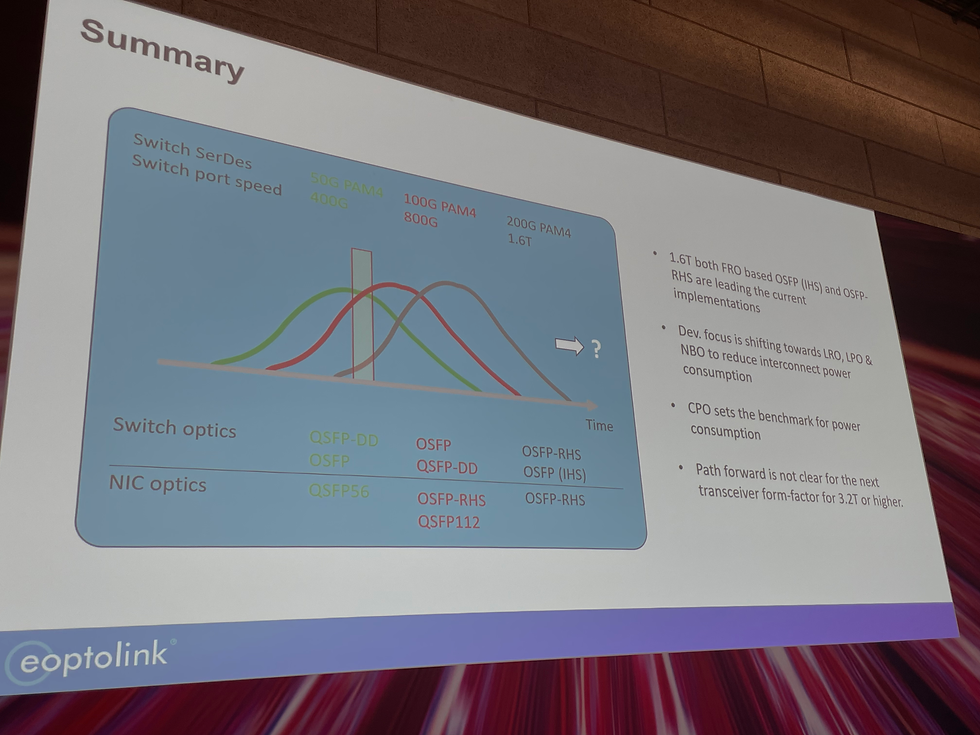
1. Optical module evolution: from 400G to 1.6T
400G era: QSFP-DD was the mainstream form factor, using 8 lanes × 50G SerDes.
800G generation: the main form factors are OSFP and QSFP-DD800, with OSFP the more mainstream of the two.
Early 1.6T implementations: the industry is currently taking two directions:
OSFP with external cooling
OSFP with integrated cooling
This shows that as data rates rise, thermal and power management has become a design bottleneck.
2. Comparing optical interconnect architectures
Eoptolink analyzed different ways to implement 1.6T optical modules and compared their power consumption and link loss:
Full DSP (FRO, Full Retimed Optics)
Pros: the highest link budget and strong flexibility, tolerating about 4 dB of loss.
Cons: the highest power; current 1.6T modules draw about 24W.
LRO/TRRO (Linear Receive Optics)
Pros: removes the TX DSP and keeps only RX linear amplifiers, cutting power.
Cons: depends on Switch ASIC performance, making link design harder.
Onboard/Co-Packaged Optics (NPO, CPO)
NPO: still in the exploration stage, with no mature data yet.
CPO: seen as the best answer on power; public industry data shows just 7–9W, far better than conventional pluggables.
👉 The customer's dilemma: they want the link budget and flexibility of FRO while also getting the low-power advantage of CPO. This has become the biggest challenge in system design.
3. Power breakdown and trend analysis
Eoptolink compared the sources of power consumption in 800G and 1.6T modules:
Common parts (MCU, power management): a fixed share.
Optics (lasers, modulators): limited increase.
DSP: the main source of power growth.
Taking 1.6T modules as an example:
FRO: about 24W
Eoptolink's own optimized design: about 15W
LRO: estimated to reach 10W
CPO: just 7–9W at best
In addition, at the system level, Switch ASIC power grows exponentially as line rate and lane count increase, driving total system power up linearly.
4. Uncertainty on the road to 3.2T
Today: 800G is ramping fast, while 1.6T has just started and is still dominated by FRO.
Next step: the industry is focusing on linear architectures such as LRO, RPO and MPO, aiming to bring power down toward CPO levels.
Challenge: there is not yet a clear solution for the SerDes, optoelectronic components and packaging technology that 3.2T requires.
Conclusion
Eoptolink's view at ECOC 2025 highlights the core tension in data center optical interconnect:
Power vs. performance: FRO offers the strongest link flexibility but high power; CPO has the lowest power but limited flexibility.
Multiple technologies will coexist: in the near term, FRO, LRO and CPO will coexist by application, and no single technology will fully replace the others.
Future uncertainty: 3.2T is still in the exploration stage and requires breakthroughs in next-generation DSPs, module packaging and cooling.
Overall, Eoptolink stressed that the industry is in a transition period of 800G stabilizing, 1.6T initial deployment, and 3.2T exploration. Finding the best balance among power, performance and cost will determine the direction of next-generation data center optical interconnect.




Comments